These NCERT Solutions for Class 8 Maths Chapter 5 Data Handling Ex 5.1 Questions and Answers are prepared by our highly skilled subject experts.
NCERT Solutions for Class 8 Maths Chapter 5 Data Handling Exercise 5.1
Question 1.
For which of these would you use a histogram to show the data?
(a) The number of letters for different areas in a postman’s bag.
(b) The height of competitors in an athletics meet.
(c) The number of cassettes produces by 5 companies.
(d) The number of passengers boarding trains from 7:00 a.m. to 7:00 p.m. at a station. Give reason for each.
Solution:
We represent those data by a histogram which can be grouped into class intervals so, for (b) and (d), the data can be represented by histograms.
![]()
Question 2.
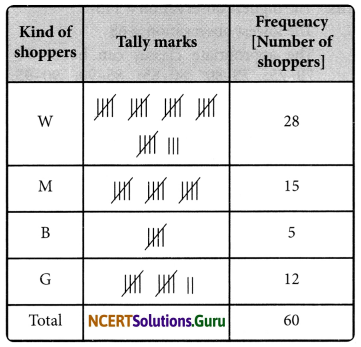
The shoppers who come to a departmental store are marked as man (M) woman (W), boy (B) or girl (G). The following list gives the shoppers who come during the first hour in the morning:
W W W G B W W M G G M M W W W W G B M W B G G M W W M M W W W M W B W G M W W W W G W M M W W M W G W M G W M M B G G W
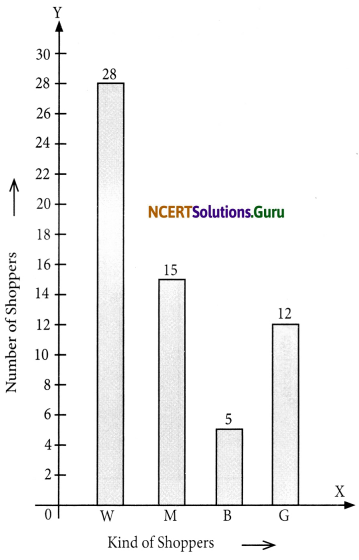
Make a frequency distribution table using tally marks. Draw a bar graph to illustrate it.
Solution:
The frequency distribution table for the above data can be:
We can represent the above data by a bar graph as given below:
Question 3.
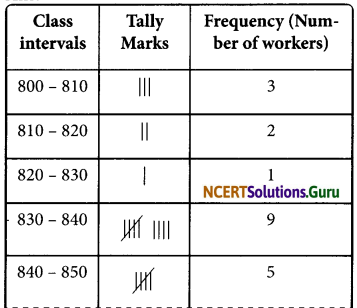
The weekly wages (in ₹) of 30 workers in factory are:
830, 835, 890, 810, 835, 836, 869, 845, 898, 890, 820, 860, 832, 833, 855, 845, 804, 808, 812, 840, 885, 835, 835, 836, 878, 840, 868, 890, 806, 840
Using tally marks, make a frequency table with intervals as 800 – 810, 810 – 820, and so on.
Solution:
Question 4.
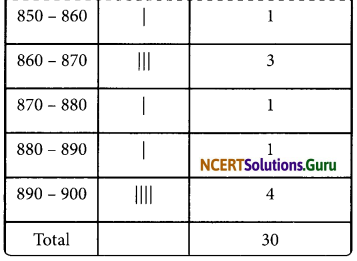
Draw a histogram for the frequency table made for the data in Question 3, and answer the following questions.
(i) Which group has the maximum number of workers?
(ii) How many workers earn ₹ 850 and more?
(iii) How many workers earn less than ₹ 850?
Solution:
The histogram for the above frequency table is given below. Here we have represented the class intervals on the horizontal axis and frequencies of the class intervals along the y-axis (vertical axis).
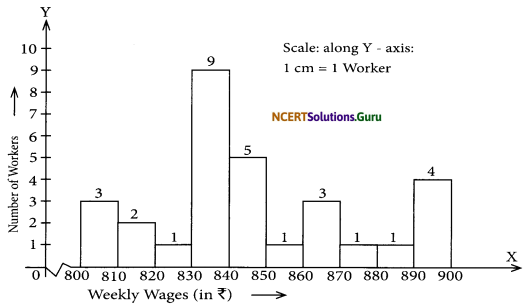
Now, we can answer the question.
(i) The group 830 – 840 has the maximum number of workers.
(ii) Number of workers earning ₹ 850 or more = 1 + 3 + 1 + 1 + 4 = 10
(iii) Number of workers earning less than ₹ 850 = 3 + 2 + 1 + 9 + 5 = 20
![]()
Question 5.
The number of hours for which students of a particular class watched television during holidays is shown through the given graph. Answer the following.
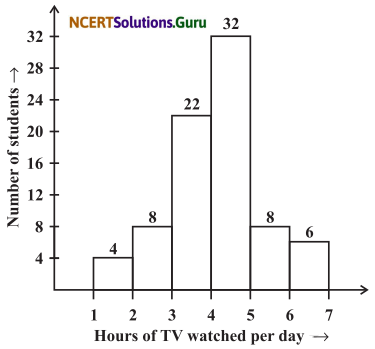
(i) For how many hours did the maximum number of students watched TV?
(ii) How many students watched TV for less than 4 hours?
(iii) How many students spent more than 5 hours in watching TV?
Solution:
(i) The maximum number of students watch TV for 4 to 5 hours.
(ii) 4 + 8 + 22 = 34 students watch TV for less than 4 hours.
(iii) 8 + 6 = 14 students spend more than 5 hours in watching TV.