These NCERT Solutions for Class 7 Science Chapter 13 Motion and Time Questions and Answers are prepared by our highly skilled subject experts to help students while preparing for their exams.
Motion and Time NCERT Solutions for Class 7 Science Chapter 13
Class 7 Science Chapter 13 Motion and Time Textbook Exercise Questions and Answers
Question 1.
Classify the following as motion along a straight line, circular or oscillatory motion:
a. Motion of your hands while running.
b. Motion of a horse pulling a cart on a straight road.
c. Motion of a child in a merry-go-round.
d. Motion of a child on a see-saw.
e. Motion of the hammer of an electric bell.
f. Motion of a train on a straight bridge.
Answer:
a. Oscillatory motion
b. Along a straight line (rectilinear motion)
c. Circular motion
d. Oscillatory motion
e. Oscillatory motion
f. Rectilinear motion
Question 2.
Which of the following are not correct?
a. The basic unit of time is second.
b. Every object moves with a constant speed.
c. Distances between two cities are measured in kilometres.
d. The time period of a given pendulum is not constant.
e. The speed of a train is expressed in m/h.
Answer:
b., d. and e.
Question 3.
A simple pendulum takes 32 s to complete 20 oscillations. What is the time period of the pendulum?
Answer:
Number of oscillations = 20
Total time taken to complete 20 oscillations = 32 s
Time period = \(\frac{\text { Total time taken }}{\text { Number of oscillations }}\)
= \(\frac {32}{20}\) = 1.6 s
Question 4.
The distance between two stations is 240 km. A train takes 4 hours to cover this distance. Calculate the speed of the train.
Answer:
Distance between two stations = 240 km
Time taken = 4 h
Speed = \(\frac{\text { Distance }}{\text { Time taken }}\) = \(\frac {240}{4}\) = 60 km/h
![]()
Question 5.
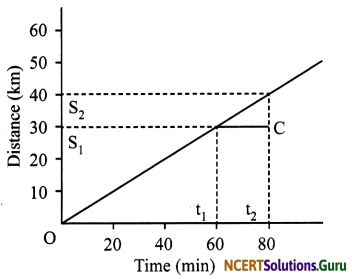
The odometer of a car reads 57321.0 km when the clock shows the time 08:30 AM. What is the distance moved by the car, if at 08:50 AM, the odometer reading has changed to 57336.0 km? Calculate the speed of the car in km/min during this time. Express the speed in km/h also.
Answer:
Initial reading of the odometer of the car = 57321.0 km
Final reading of the odometer of the car = 57336.0 km
Distance covered by the car = Final reading of the odometer – Initial reading of the odometer
= 57336.0 – 57321.0 km = 15 km
The given car starts at 8:30 AM and stops at 8:50 AM.
Therefore, time taken by the car to cover the distance is (8:50 – 8:30) min = 20 min
Distance covered by the car = 15 km
Time taken by the car = 20 min
Speed = \(\frac{\text { Distance covered }}{\text { Time taken }}\)
= \(\frac{15 \mathrm{~km}}{20 \mathrm{~min}}\)
= 0.75 km/min
Again,
60 min = 1 h
20 min = \(\frac {1}{60}\) × 20 = \(\frac {1}{3}\)h
Time taken by the car = \(\frac {1}{3}\)h
Speed = \(\frac{\text { Distance covered }}{\text { Time taken }}\)
= \(\frac{15 \mathrm{~km}}{\left(\frac{1}{3}\right) \mathrm{h}}\)
= 45 km/h
Question 6.
Salma takes 15 minutes from her house to reach her school on a bicycle. If the bicycle has a speed of 2 m/s, calculate the distance between her house and the school.
Answer:
Time taken by Salma to reach her school from her home = 15 min
= 15 × 60 = 900 s
Speed of her bicycle = 2 m/s
Distance covered = Speed × Time taken = 2 × 900= 1800 m
1000 m = 1 km
∴ Distance = \(\frac {1}{1000}\) × 1800 = 1.8 km
Question 7.
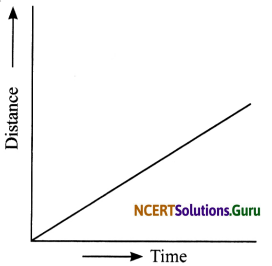
Show the shape of the distance-time graph for the motion in the following cases:
a. A car moving with a constant speed.
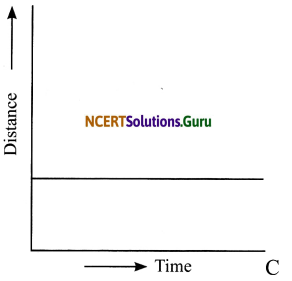
b. A car parked on a side road.
Answer:
a. A car moving with a constant speed covers equal distances in equal intervals of time. Such motion of car is represented by the given distance-time graph.
b. The distance-time graph of a car parked on a road side is such that with the increase in time, there is no change in distance, as shown in the given figure.
Question 8.
Which of the following relations is correct?
a. Speed = Distance × Time
b. Speed = Distance/Time
c. Speed = Time/Distance
d. Speed = 1/Distance Time
Answer:
b. Speed = Distance × Time
Question 9.
The basic unit of speed is
a. km/min
b. m/min
c. km/h
d. m/s
Answer:
d. m/s
![]()
Question 10.
A car moves with a speed of 40 km/h for 15 minutes and then with a speed of 60 km/h for the next 15 minutes. The total distance covered by the car is:
a. 100 km
b. 25 km
c. 15 km
d. 10 km
Answer:
b. 25 km
First, the car is moving with 40km/h for 15 minutes.
15 minutes = 15/60 h = 1/4 h
Distance covered = 40 × 1/4 = 10 km
Second, the car is moving with 60 km/h for 15 minutes.
Distance covered = 60 × 1/4 = 15 km
Total distance covered = 10 km + 15 km = 25 km
Question 11.
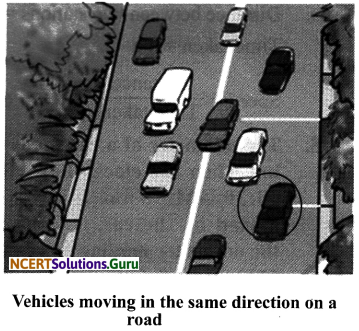
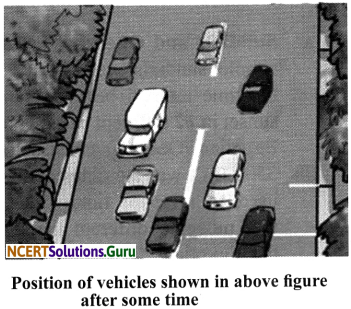
Suppose the two photographs, shown below, had been taken at an interval of 10 seconds. If a distance of 100 meters is shown by 1 cm in these photographs, calculate the speed of the blue car (circled).
Answer:
First, measure the distance moved by the car with the help of scale and then proceed as given below.
Suppose the distance measured by the scale is 2 cm.
Multiply 2 with 100 to get the actual distance = 2 × 100 = 200 m.
(given, 1cm = 100 m)
Interval of time between the photos taken = 10 s.
Speed of the blue car = 200/10 = 20 m/s
Question 12.
Figure given here shows the distance-time graph for the motion of two vehicles A and B. Which one of them is moving faster?
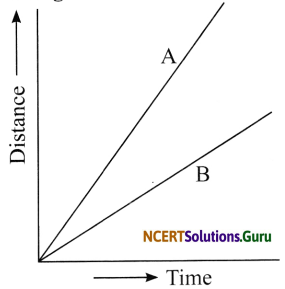
Distance-time graph for the motion of two cars
Answer:
Vehicle A is moving faster which is evident from the higher slope for distance-time graph of this vehicle compared to that of the other vehicle.
Question 13.
Which of the following distance-time graphs shows a truck moving with speed which is not constant?
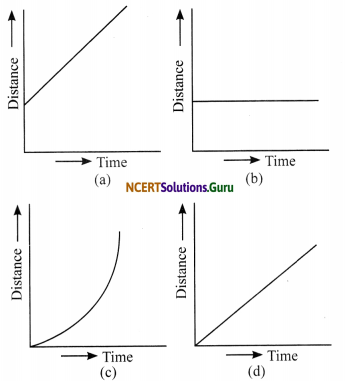
Answer:
(c) The slope of the graph in this option is not a straight line and hence it does not show a uniform motion.
NCERT Extended Learning Activities and Projects
Question 1.
You can make your own sundial and use it to mark the time of the day at your place. First of all find the latitude of your city with the help of an atlas. Cut out a triangular piece of a cardboard such that its one angle is equal to the latitude of your place and the angle opposite to it is a right angle. Fix this piece, called gnomon, vertically along a diameter of a circular board a shown in the figure. One way to fix the gnomon could be to make a groove along a diameter on the circular board.
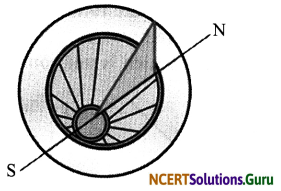
Next, select an open space, which receives sunlight for most of the day. Mark a line on the ground along the North-South direction. Place the sundial in the sun as shown in the figure. Mark the position of the tip of the shadow of the gnomon on the circular board as early in the day as possible, say 8:00 AM. Mark the position of the tip of the shadow every hour throughout the day. Draw lines to connect each point marked by you with the centre of the base of the gnomon as shown in the figure. Extend the lines on the circular board up to its periphery. You can use this sundial to read the time of the day at your place. Remember that the gnomon should always be placed in the North-South direction as shown in the figure.
Hint:
Do it yourself.
![]()
Question 2.
Collect information about time-measuring devices that were used in the ancient times in different parts of the world. Prepare a brief write up on each one of them. The write up may include the name of the device, the place of its origin, the period when it was used, the unit in which the time was measured by it and a drawing or a photograph of the device, if available.
Hint:
a. Sundials and Obelisks: In 1500 B.C. simple sundials were used to divide the time interval between sunrise and sunset in 12 different parts. The Ancient Egyptian Obelisk, constructed about 3500 B.C. was the oldest shadow clock used to measure time. The shadows that move to different marks enabled the Egyptians to calculate time which helped to divide the day into two parts.
b. Sand-glass: It is also called an hourglass, made up of two conical glasses connected vertically by the narrow neck, came into being in the 14th Century. It could measure passage of specific time period depending upon the size and width of the glass and the quantity of sand in it.
c. Water clock: It was known to have existed in Babylon in Egypt around 16th Century. It was used to measure time observing steady flow of water from or into a container. Measurements were marked on the container but there were variations due to the pressure of water flow.
d. Candle clock: The candle was marked with numbers and the burning of wax indicated a specific period of time. It is unknown where the candle clocks were used although it was first referred by a Chinese poet called You Jiangu in 520 A.D.
e. Pendulum: A scientific study was done around 1602 by an Italian astronomer Galileo Galilei on pendulum where its motion was used to keep a track of time. It was considered to be the the world’s most accurate time-keeping invention until 1930. The pendulum clock was invented by Christian Huygens in the year 1658 which was used till 270 years.
f. The Quartz: In early 20th Century, Albert Einstein proposed theories of relativity and defined time as the fourth dimension. The quartz clocks were developed in 1930 which were far more improvised version of a pendulum clock. The quartz crystal has to be placed in the suitable circuit in a way that creates vibrations in the crystal to generate a constant frequency. This is used to operate electronic clock display.
g. Last, the atomic and laser invention in 1960’s has changed the measurement of time forever. These are the most accurate clocks so far.
Question 3.
Make a model of a sand clock which can measure a time interval of 2 minutes.

Hint:
Do it yourself.
Question 4.
You can perform an interesting activity when you visit a park to ride a swing. You will require a watch. Make the swing oscillate without anyone sitting on it. Find its time period in the same way as you did for the pendulum. Make sure that there are no jerks in the motion of the swing. Ask one of your friends to sit on the swing. Push it once and let it swing naturally. Again measure its time period. Repeat the activity with different persons sitting on the swing. Compare the time period of the swing measured in different cases. What conclusions do you draw from this activity?
Hint:
We can conclude that the time period of a pendulum depends on the acceleration due to gravity and the length of the suspension. So keeping those constant, the time period of the simple pendulum will remain constant. It will not change with changing mass or weight of bob (people sifting on the swing).
Activity 1
Objective: To show that some objects moves fast and some objects move slow.
Material Required: Pen and paper.
Procedure:
- Find the distance covered by four different modes of transport.
- Also, record the time taken by each of them to cover a certain distance.
Observations:
| Mode of transport | Distance covered (m) | Time taken (min) |
Speed (m/min) |
| Walking | 200 | 10 | 200/10 = 20 |
| Bicycle | 1500 | 25 | 1500/25 = 60 |
| Auto-rickshaw | 2000 | 25 | 2000/25 = 80 |
| Car | 6000 | 20 | 6000/20 = 300 |
Conclusion: In this observation, car has the fastest speed while walking has the slowest speed.
Measuring Time: There are many events in nature that repeat after a certain time interval:
- Morning marks the rising of the sun and time taken by earth to complete one rotation.
- Day and Night mark the time between the sunrise and sunset.
- Month marks the time between two new moons.
- Year marks the time the earth takes to complete its one revolution around the sun.
Time Measuring Devices or Clocks:
Clocks use the concept of periodic motion to measure time. It means that it uses motion that repeats itself in equal intervals of time. There are different types of time measuring devices. Some ancient devices are:
i. Sundial: A sundial measures time by the position of the shadow cast by the sun during different times of the day.
ii. Sand clock: The sand clock uses the flow of sand (from one glass bulb to another) to measure time. The length of time taken by the sand to pass from one bulb of the sand clock to the other, gives a constant time interval.
iii. Water clock: A water clock uses the rate at which water drops from one vessel to another to measure time intervals. Water is allowed to drip from one vessel to another vessel kept at a lower level. The time taken by the entire water to drop from the upper vessel to the lower vessel is used for measuring time intervals. Every time the upper vessel is filled with water, its water takes exactly the same time to drip into the lower vessel.
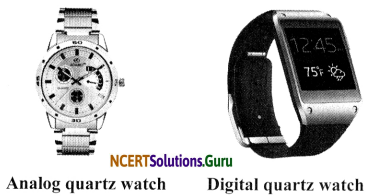
The latest trends in measurement of time: The clocks and watches which use quartz crystals for their working are called quartz clocks and quartz watches. The time measured by quartz clocks and watches is much more accurate than that measured by clocks and watches available earlier.
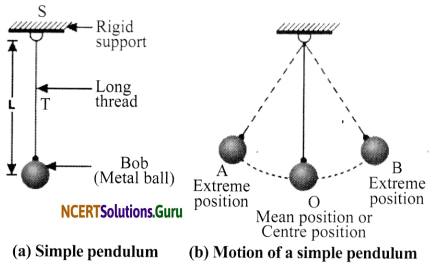
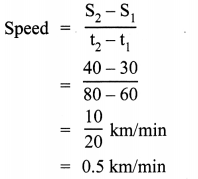
Periodic Motion of a Simple Pendulum:
One of the most well-known periodic motions is that of a simple pendulum. A simple pendulum consists of a small metallic ball or a piece of stone suspended from a rigid stand by a thread. The metallic ball is called the bob of the pendulum. When the bob of the pendulum is released after taking it slightly to one side, it begins to move to and fro. The to and fro motion of a simple pendulum is an example of a periodic or an oscillatory motion. The pendulum is said to have completed one oscillation when its bob, starting from its mean position O, moves to A, then to B and back to O. The pendulum also completes one oscillation when its bob moves from one extreme position A to the other extreme position B and comes back to A. The time taken by the pendulum to complete one oscillation is called its time period.
![]()
Activity 2
Objective: To determine the time-period of a simple pendulum.
Materials Required: Metallic bob, string (thread), stop watch and meter scale.
Procedure:
- To set the pendulum in motion, hold the bob gently and move it slowly to one side (say, right side).
- Now release the bob from its displaced position gently.
- Start a stop watch when the bob is at one of the extreme positions. Keep on counting the number of oscillations made by the pendulum bob.
- Measure the time which the pendulum bob takes to make 20 complete oscillations.
Divide the time taken for 20 oscillations by 20. This will give the time taken by pendulum for making one oscillation. It is the time-period of the pendulum.
Observations:
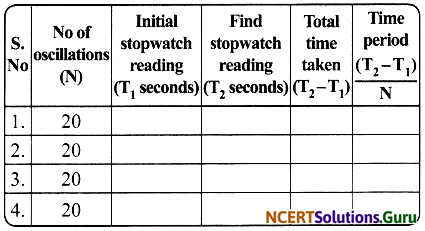
Conclusion: The time period of the pendulum calculated is seconds. The time period of a given pendulum remains constant.
Units of Time and Speed: Unit of distance is metre (m) or kilometre (km) and that of ‘ time is second (s) or hour (h). Common units of speed are therefore metre/second (m/s) or kilometre/hour (km/h) Units are always written in singular, that is, km and not kms.
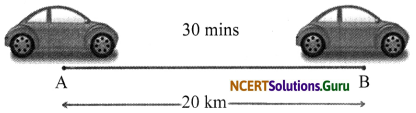
If a car takes 30 min to travel a distance of 20 km, speed will be:
Speed = Distance/Time
Speed = 20 km/30 min = 20 km/ (30/60) h
Speed = 40 km/h
Minute : 1 minute has 60 seconds in it.
Hour : 1 hour has 60 minutes in it.
Day : 1 day has 24 hours in it.
Month : 1 month has 30 or 31 days in it.
Year : 1 year has 365 days in it (366 days during a leap year).
Speedometer: An instrument on a vehicle’s dashboard which indicates the speed of the vehicle when it is running is called speedometer. The speedometer has the symbol ‘km/h’ written on its dial. Speedometer tells us the speed of a running vehicle at that instant of time in kilometres per hour.
Odometer: It is a device used to measure the distance covered by a vehicle. Odometer records the total distance travelled by a vehicle in kilometres.
Distance-Time Graph: A graph which represents the distance travelled by an object with respect to time is called a distance-time graph. If a vehicle covers a distance of 5 km every hour and travels for 5 hours, the distance-time graph for the given vehicle can be plotted as follows using the table given below:
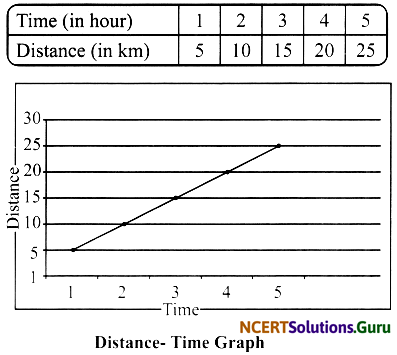
Distance time graph of a vehicle moving with a constant speed is a straight slanting line. More the slope of this graph, more is the speed of the object.
Types of Graphs: We can represent the data in pictorial form by three ways:
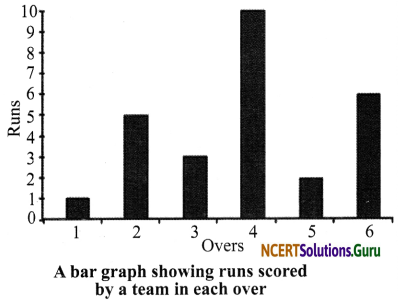
i. Bar graph: A bar graph consists of horizontal or vertical bars that show the values of one quantity against another.
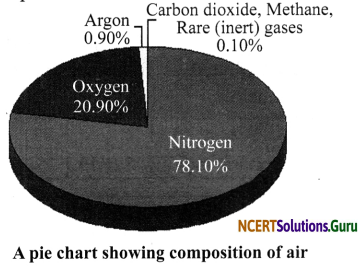
ii. Pie chart: A pie chart is a circular graph used to present relative percentages or shares of a total. It looks like a pie cut into several slices, and hence the name pie chart.
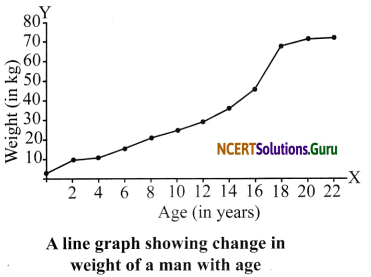
iii. Line chart: A line that joins dots plotted on a graph paper is called a line graph. It is used to show the variation of one quantity with respect to another.
Advantages of Graphs:
- The inter-dependence of two variables can be established easily using graphs, e.g, if the graph is a straight line, it indicates direct proportionality between the variables.
- The mean value of the ratio of two variables can be accurately obtained using graphs without rigorous mathematical calculations.
- The probable value of variables can be calculated with the help of graph within or beyond the observed values from the mean value without lengthy numerical computations.
- An important advantage of graphs is that some of the salient features of a given experimental data can be seen visually, which cannot be easily concluded by simply looking at the experimental data. For example, the point of maximum, minimum or inflexion can be easily identified by careful observation of the graph representing the experimental data.
Class 7 Science Chapter 13 Motion and Time Additional Important Questions and Answers
Very Short Answer Type Questions
Question 1.
What is motion?
Answer:
Motion is a change in the position of an object with time.
Question 2.
What is the S.I unit of distance?
Answer:
Metre.
Question 3.
Name an object that shows oscillatory motion.
Answer:
Pendulum.
Question 4.
What is circular motion?
Answer:
Motion of an object in a circular path is called circular motion.
![]()
Question 5.
Name the device on vehicles to track the distance covered.
Answer:
Odometer.
Question 6.
What type of graph is used to represent motion of an object?
Answer:
Distance-time graph.
Question 7.
What is the basic unit of time?
Answer:
The basic unit of time is a second. Its symbol is ‘s’.
Question 8.
What is speedometer?
Answer:
Speedometer is an instrument that indicates the speed of a vehicle.
Question 9.
What is speed?
Answer:
The distance moved by an object in a unit time is called its speed.
Question 10.
What is oscillatory motion?
Answer:
The to and fro motion of an object is called oscillatory motion.
Question 11.
What is non-uniform motion?
Answer:
If the speed of an object moving along a straight line keeps changing, its motion is said to be non-uniform.
![]()
Question 12.
What is uniform motion?
Answer:
An object moving along a straight line with a constant speed is said to be in uniform motion.
Question 13.
What is the smallest time interval that can be measured with commonly available clocks and watches?
Answer:
The smallest time interval that can be measured with commonly available clocks and watches is one second.
Question 14.
What is bob?
Answer:
The metallic ball in a simple pendulum is called bob.
Question 15.
How many types of graphs are there?
Answer:
(a) Bar graph, (b) Line graph and (c) Pie chart.
Question 16.
What are X and Y-axis in a graph?
Answer:
The horizontal line in a graph is called the X-axis and the vertical line is called the Y-axis.
Question 17.
How did our ancestors find out the time of the day?
Answer:
Our ancestors could tell the approximate time of the day by looking at shadows.
Question 18.
Name some units of measuring time.
Answer:
Second, minute, hour, etc.
![]()
Question 19.
Name some devices which are used to measure time.
Answer:
Quartz clock, sundial and sand clock.
Question 20.
What is a distance-time graph?
Answer:
A graph representing the motion of an object in pictorial form by plotting its distance travelled and time taken, is called a distance-time graph.
Short Answer Type Questions
Question 1.
What are the characteristics of the distance-time graph for an object moving at a uniform speed?
Answer:
The characteristics of distance-time graph for an object moving with uniform speed are:
a. It is always a straight line.
b. The uniform speed of the moving object is equal to the slope of the straight line plotted.
Question 2.
State the factors on which the time period of a simple pendulum depends.
Answer:
Factors affecting the time period of a simple pendulum are:
- The time period of oscillation is directly proportional to square root of the effective length.
- The time period of oscillation is inversely proportional to the square root of acceleration due to gravity.
Question 3.
How do we know an object is moving faster as compared to another object?
Answer:
By finding the distance travel by a moving body in unit time, say 1 h or 1 s, we know the speed of an object that helps us to know which one is moving faster, i.e., having greater speed.
![]()
Question 4.
A simple pendulum takes 15 seconds to complete 5 oscillations. What is the time period of the pendulum?
Answer:
The time taken by pendulum to complete 1 oscillation is called the time period.
The time taken by pendulum to complete 5 oscillation = 15 s
The time taken by pendulum to complete 1 oscillation = 15/5 = 3 s
So, time period is 3 seconds.
Question 5.
Give the difference between uniform speed and non-uniform speed.
Answer:
| Uniform speed | Non-uniform speed |
| If a body covers equal distances in equal intervals of time, then its speed is said to be uniform. | If a body covers unequal distances in equal intervals of time or equal distances in unequal intervals of time, then its speed is said to be non-uniform. , |
Question 6.
What are the points that should be considered while choosing the most suitable scale for drawing a graph?
Answer:
Some of the points to be kept in mind while choosing the most suitable scale for drawing a graph are:
a. The difference between the highest and the lowest values of each quantity.
b. The intermediate values of each quantity, so that with the scale chosen it is convenient to mark the values on the graph.
c. To utilise the maximum part of the paper on which the graph is to be drawn.
Question 7.
Define units of speed.
Answer:
In the S.I system, the unit of speed is m s-1 (m/s). If the distances covered are very small, then the speed is expressed in cm/s or cm s-1. For example, if we want to know the speed at which an ant or an earthworm is moving, we will express it in cm s-1.
On the other hand if the distance covered is fairly large, the speed is expressed in km/h or km h-1, such as the speed of a train.
Question 8.
What is simple pendulum? How does it perform an oscillatory motion?
Answer:
A simple pendulum consists of a small metallic ball suspended from a rigid stand by a thread. The metallic ball is called the bob of pendulum. When the bob of a pendulum is released after taking it slightly to one side, it begins to move to and fro. The to and fro motion of simple pendulum is an example of oscillatory motion.
Question 9.
A train is running at a speed of 50 km h-1. How long will it take to cover a distance of 250 km?
Answer:
Speed = 50 km h-1
Distance = 250 km
Speed = \(\frac{\text { Distance }}{\text { Time }}\) or Time = \(\frac{\text { Distance }}{\text { Speed }}\)
Time = 250 km/50 km h-1
= 5 h
![]()
Question 10.
Find the speed of a car that travels 300 km in 6 hours.
Answer:
Time = 6 hours
Distance = 300 km, Speed =?
Speed = Distance covered/Time taken
= 300 km/6 h
= 50 km/h
Question 11.
A car travels a distance of 200 km at the speed of 50 km/h. Calculate the time taken to cover the distance.
Answer:
Distance = 200 km
Speed = 50 km/h
Time = Distance/Speed
= 200/50 = 4 h
Question 12.
What does the path of an object look like when it is in non-uniform motion?
Answer:
In non-uniform motion, the path of an object can be a curved line, zig-zag line or even a circle. It can have any shape. This is because in non-uniform motion, speed is not constant. The direction of motion may change.
Question 13.
Why do we need to measure time?
Answer:
We measure time for different reasons:
- Farmers need to measure the time between sowing and harvesting of crop.
- Students need to measure time to complete an examination.
- A traveller needs to measure the time of his journey.
- A sportsman needs to measure the time he might take to complete an event.
- Doctors need to measure the number of times the heart beats in one minute for a patient.
Long Answer Type Questions
Question 1.
Explain how in ancient times a day, a month and a year were measured?
Answer:
Our ancestors noticed that many events in nature repeat themselves after definite intervals of time. For example, they found that the sun rises every day in the morning. The time between one sunrise and the next was called a day. Similarly, a month was measured from one new moon to the next. A year was fixed as the time taken by the earth to complete one revolution of the sun.
Question 2.
Explain how we can plot a graph.
Answer:
To plot a graph, take a graph paper. At the centre of the paper, draw two lines perpendicular to each other. Mark the point of intersection of the lines as ‘O’. The horizontal line is called the X-axis, while the vertical line is called the Y-axis. The point of intersection of the two axes is called the origin, ‘O’. Take one quantity along the X-axis and the other along the Y-axis, after choosing suitable scales for both. For every value along one axis, mark a point matching the related value on the other axis. Join the point, and your graph is ready.
![]()
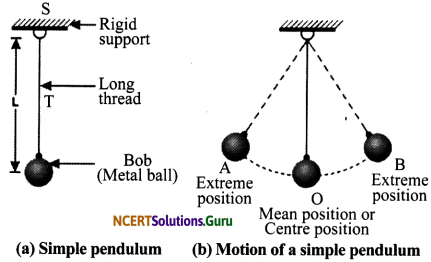
Question 3.
Complete the data of the table given below with the help of the distance-time graph given in the figure.
Answer:
The graph given above represents a case of uniform motion. Hence, from the graph;
| Distance (m) | 0 | 4 | 8 | 12 | 16 | 20 |
| Time (s) | 0 | 2 | 4 | 6 | 8 | 10 |
Question 4.
Given below is the distance-time graph of the motion of an object.
a. What will be the position of the object at 20 s?
b. What will be the distance travelled by the object in 12 s?
c. What is the average speed of the object?
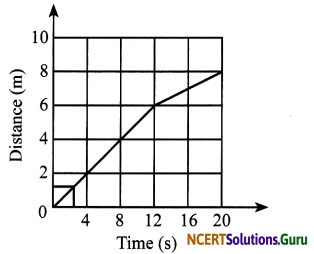
Answer:
a. From the graph, it is clear that the position at 20 s is 8 m.
b. Distance travelled by the object in 12 s is 6 m.
c. Average speed = \(\frac{\text { Total distance }}{\text { Total time }}\)
= \(\frac {8}{20}\) = 0.4 m/s
Question 5.
What are the advantages of graph?
Answer:
Advantages of graphs are:
a. The inter-dependence of two variables can be established easily, e.g, if the graph is a straight line, it indicates direct proportionality between the variables.
b. The mean value of ratio of two variables can be accurately obtained without rigorous mathematical calculations.
c. The probable value of variables can be calculated with the help of graph within or beyond the observed values from the mean value without lengthy numerical computations.
d. An important advantage of graphs is that some of the salient features of a given experimental data can be seen visually, which cannot be easily concluded by simply looking at the experimental data. For example, the point of maximum, minimum or inflexion can be easily identified by careful observation of the graph representing the experimental data.
Picture-Based Questions
Question 1.
a. Observe the following figure and identify it.
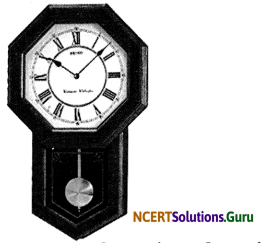
b. What type of motion does it undergo?
c. Name the devices used by our ancestors to measure the time.
Answer:
a. The above figure is of a pendulum clock.
b. It undergoes periodic or oscillatory motion.
c. Sundials, water clocks, sand clocks, etc.
![]()
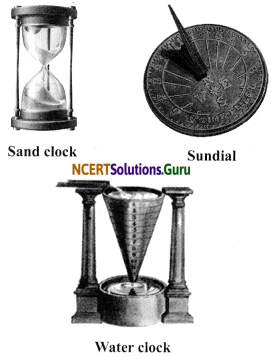
Question 2.
Observe the following figures and identify them:
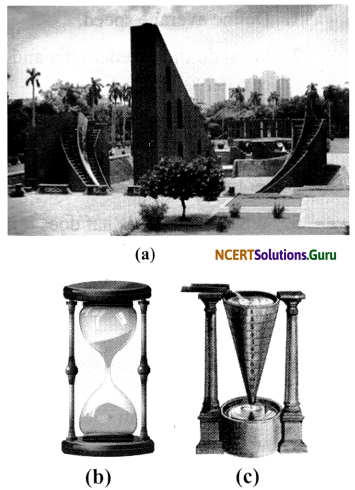
Answer:
a. Sundial at Jantar-Mantar in Delhi
b. Sand clock
c. Water clock
Question 3.
a. Observe the following figure and identify it.
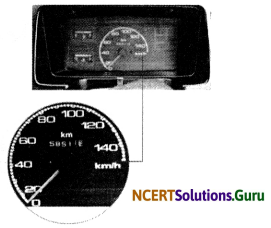
b. State the function of the device shown above.
Answer:
a. Speedometer.
b. It measures the speed of a vehicle.